Showing posts with label bank profitability. Show all posts

Saturday, 23 November 2013

Bankers: Are We Accountable?

Twenty years ago there were 14,000 FDIC-insured financial institutions. Today that number is cut in half. The reasons are many. And yes, some are beyond our control such as population mobility, technology, and the need for some scale to invest enough to remain relevant. But, as my one-time Division Officer, Lieutenant Proper, once told me: "Be careful pointing your finger, because the other three are pointing at you."

I recently made a presentation to staffers and advisers to the Pacific Coast Banking School (PCBS) regarding what I would change in the curriculum. My theme was that if we keep teaching bankers the same things, and expect different results (i.e. not cutting our industry by half), then we are insane. I don't think I'll be invited back.

Banking is an industry that is particularly susceptible to external forces such as interest rates, business and consumer confidence, and the economy (both local and national). So if things go wrong, there is plausible deniability as to what or who is responsible. Strange that when things go right, it's difficult to find plausible deniers. But I digress.

Because of the external forces that impact results, it is typical to gravitate to holding ourselves accountable to things under our direct control... i.e. our expense budget. Volumes and balances... not my fault, there's no loan demand. Margins... not my fault, the irrational competitor down the street is being too aggressive. Profits in fee based businesses... not my fault, soft insurance market.

I find this when analyzing client profitability reports. Nobody wants to absorb the costs of support centers, such as HR, IT, and Marketing, or overhead centers such as Finance or Executive. Hold them accountable for their direct profits, because that is what they can control. It reminds me of Louisiana Senator Russell Long's quip in the 1950's... "don't tax you, don't tax me, tax that fella behind the tree." I suppose if nobody finds value in support centers to the point they agree to pay for it, we should eliminate those costs.

I think the answer to move our industry forward by establishing an accountability culture is to identify a few, transparent metrics that are consistent with strategy that hold managers accountable for continuous improvement. To overcome macro-economic factors, use trends and comparatives. For example, if you hold branch managers accountable to continuously improve their deposit spreads, compare them to the average and top quartile deposit spreads of all of your branches. The result of this accountability should be continuous improvement in your bank's cost of funds compared to peers. But instead of managing at the "top of the house" (i.e. bank's total cost of funds), we burrow down to the managers responsible for generating funding.

But since there is some art and science that goes into developing management information to establish accountability at the ground level, those managers that don't shine will frequently lob darts onto the results. But bankers that are committed to identifying and executing on a strategy that differentiates them from the remaining 7,000 FIs, should identify the metrics that correlate to successful strategy execution. 

And when managers challenge the message to dilute their accountability, senior leaders must be exactly that...

Leaders.


~ Jeff


Sunday, 13 January 2013

Should Banks Jettison Unprofitable Customers?

No.

I will tell you why in a moment, but first why I thought of this question.

Alan Weiss of Summit Consulting penned a book called The Consulting Bible (see my bookshelf if interested in the book). In it, Weiss suggests you jettison the lower end of your client list when you win new clients. His reasons:

  • The client is no longer profitable.
  • You are bored with the work.
  • The client is troublesome.
  • The work is unpleasant.
Financial institutions rarely go through such an exercise. In fact, I am currently preparing for a meeting with a client to discuss what to do about unprofitable branches. It has always been challenging to advise clients to reduce rather than to add. But to add value to customer interactions in banking, we have to dedicate time to making our customers situation better, in some way. Continuing to rely on having a nearby branch or a mobile app to add value will solidify our position as a commodity, in my opinion.

Instead, what we can offer customers is hassle free banking, improved financial condition, and peace of mind. To do that, we need talented employees with time. Time cannot be expanded. Giving 110% of your time only makes sense on a t-shirt.

But unlike consulting, financial institutions make most of their revenue on the spread. If an unprofitable customer keeps $10,000 in deposit balances with you and you can re-deploy that money at a 3% spread, then you generate $300 in revenue on very little marginal cost. Letting that customer go to a competitor will not reduce employee or occupancy expense. In fact, you would experience very little cost reduction (FDIC insurance and possibly a small data processing savings). 

But what you can do is push customer service to the appropriate level based on the value of the customer to you. Keep your most talented employees reserved for your most profitable and strategically important customers. Because those customers have the greatest potential to appreciate the value your FI brings to their situation. Growing high value customers while properly serving commodity customers is critical to improving your FI's relevance and breaking the commodity cycle.

Any stories out there about identifying and serving high value customers appropriately?

~ Jeff

Friday, 5 October 2012

Banking's Curious Lack of Profits in Fee-based Businesses

Remember the good old days when bankers talked big about their fee income prowess? And bank stock analysts issued glowing reports about revenue diversification, and the banks that get “it”. As a side note, if anybody knows what “it” is, please let me know. Because in the fee based business game, “it” appears to be wasted effort.

Why? Because most of us are not making serious money, if we’re making anything at all, from our fee-based lines of business (LOBs). What do I base this on? My firm has been measuring the profitability of LOBs and products since our inception. The average profitability of fee-based products was -10% during the first quarter of 2003, and is –7% during the first quarter of 2012. Are there exceptions? Yes. But on the whole, we have laid a giant egg.

This sad truth reared its head in profit improvement engagements that I worked on. Banks that have meaningful fee based LOBs typically dropped little to the bottom line. We recommend changes to not only get profits to where they should be, as defined by RMA’s common sized income statement (see table for Insurance Agencies), but also to absorb some overhead/support costs from the bank.

I like using RMA numbers because 1) bankers use these statistics to evaluate borrowers by industry, and 2) they are an amalgamation of profit performance of largely private companies by NAICS code. Sure, I could use publicly traded companies. But we have to be cautious comparing a community financial institution’s brokerage operation to Charles Schwab.

But publicly traded companies can be instructive. They typically operate independently, containing HR, IT, and Marketing Departments. These departments are not usually found in community FIs brokerage arms. That is why it is important to measure these units’ profitability with an overhead/support allocation. They rely on HR, IT, etc. from the bank. They should pay for it.

I am not against fee-based LOBs. In fact, managing finances, employee benefits, and risk is becoming increasingly complex for individuals and businesses… i.e. our customers. Developing expertise can clearly be consistent with your FIs strategy.

But they must be developed and managed to deliver meaningful profits to the bottom line. Succeeding will increase the amount of business you do with existing customers, make them stickier, and your FI more valuable to them. It will also increase your profits, reduce dependence on the spread, and reduce the relative size of your big three balance sheet risks… credit, interest rate, and liquidity.

Increase profits, make customers stickier, and decrease risk. Worth it? I would say so.

How about you?

~ Jeff

Saturday, 15 September 2012

Customer Profitabilty in Banking: Do you do it?

According to an ABA survey (see table), I doubt it.

I am speaking at the upcoming ABA Marketing Conference next week. Well, maybe not as much speaking as appearing. Mary Beth Sullivan and I are appearing as guests of Susquehanna Bank's Susan Bergen, in an Oprah like talk show format. I suggested Saturday Night Live's Point-Counterpoint format, but it was rejected. To appease my objection to appearing on Oprah, they orchestrated my entrance to a Pitbull song. I did not know who Pitbull was.

Our discussion will revolve around an ABA survey done this summer regarding actions banks have taken, or intend to take, to improve profitability. One question that didn't make the cut in the interest of time, was the one represented in this post's table: Does everyone in management know profitable versus unprofitable customers the bank serves today?


If you were in the corporate headquarters of McDonald's, you would be alarmed at the results. If you are in banking... not so much alarmed as happy that so many others remain as in the dark as you. I think lack of knowledge of profitable customers comes from three things:

1. Getting such a number requires investment in resources your FI currently does not have:
2. The regulators don't require the information; and
3. Even if you had the information, what would you do about it anyway?

All are related. FIs earn money on the spread. In order to create spread, FIs focus on creating a basket of the highest yielding assets within risk parameters, while funding them with a basket of the lowest costing funding. Why do you need some fancy profitability information to tell you that?

Problem: Various assets and liabilities take differing amount of operating expenses to accumulate. Also, based on risk, different assets and liabilities require different equity allocations. If your attitude is that the "incremental" cost of chasing this business or that is minimal, you may very well be mis-allocating your precious resources to low profit customers.

For example, we have a client that served the bar/restaurant business in a college town. These establishments brought decent balances to the bank. The problem: we found employees that spent half their day sorting through the bag-fulls of cash delivered every day. Could the bank allocate that operating expense to a campaign to acquire and serve higher profit customers? Without determining the profitability of those customers, we would never know about the opportunity lost.

I think it's time to change the paradigm from acquiring the highest yielding assets and the lowest costing liabilities based solely on interest earned or cost of funds. We should instead focus on acquiring and serving baskets of the highest profit customers. Doing so will efficiently allocate resources, improve our profitability, and enhance our FIs value.

~ Jeff

Saturday, 14 July 2012

Mortgage Banking: How profitable should it be?

I recently spoke to an old friend that is a bank equity research analyst and asked him how his coverage universe was doing with second quarter earnings. He said his "mortgage banks did great". Meaning that those that specialized in originating and selling or putting residential mortgages on their books had a great quarter due to the strength of originations.

Occasionally I get asked how much a mortgage banking unit should make. This is a tough question because there are various models. One where all loans are brokered and closed in the funding bank's name (mortgage brokers). Another model is where the bank funds the loans at closing and holds them for a brief period until they are packaged and sold (mortgage banking). The opposite extreme is where the financial institution books and holds the loan until maturity or pre-payment. This model is typically followed by some thrifts and credit unions.

What has proven the least profitable model of late is the mortgage brokering or holding mortgages briefly until sold. These models tend to rely on mortgage originators for volume, versus using traditional bankers such as branch managers or consumer lenders. Mortgage originators are notorious for demanding a significant slice of the revenue pie of the mortgage banking unit. This puts pressure on profitability.

I took a look at banks within my firm's profitability universe to look for models that relied heavily on originations then quick sales. My criteria was to ensure that over 50% of the unit's revenues were from fees on sold loans. It was true that just under half of the revenues of those that I reviewed were from the spread. But I wanted to get a granular look at how much a mortgage unit "should" make. The results are in the accompanying table.

There you have it. If your financial institution has a mortgage banking unit, it seems reasonable to me that your leadership should require profits of 25% of revenue. In efficiency ratio parlance, that is a 75% efficiency ratio. Not exactly knocking the cover off of the ball.

But I have found that many mortgage origination shops subscribe to what one banker described to me as the "five cookies" approach. If there are five cookies on the plate, is it fair that one party should take four and a half and leave the crumbs for the other party? Especially since the crumb-keeper must bear most of the risk.

Why be in a business that isn't improving your bottom line? It's a fair question.

~ Jeff

Tuesday, 8 May 2012

Risk Adjusted Return on Capital (RAROC) for Financial Institutions

How do you measure the profitability of lines of business, products, or customers? The simplest form is in dollars. But does that measure the profits against the investment required to generate those profits? For example, the riskiest banking products most likely deliver the greatest dollar profits, all other things being equal. At least until the risk comes to roost.

Another means to measure profits is the ratio of profits to the size of the portfolio being measured. In banking, we call it the Return on Assets (ROA). For example, a $500 million commercial loan portfolio will have a greater dollar profit than a $100 million consumer loan portfolio, all things being equal. But the ROA of the consumer loan portfolio could be greater. But ROA does not measure the risk of what is being measured, just the relative profit contribution regardless of size.

Banking is a risk business, and has many internal and external factors that impact the amount of risk per activity. This is one reason that financial institutions are getting serious about viewing risk across the entire franchise instead of in the organizational silos where they most exist. See my post on Enterprise Wide Risk Management on this subject here.

But through it all, risk requires capital. Look at the capital needed through the recent recessionary period for credit losses provided by either private investors or the US Treasury. Regulators assign risk weightings as a proxy for how much capital is needed based on the perceived risk of the asset. For example, a security in the investment portfolio may be 20% risk weighted, versus a loan that is 100% risk weighted. The total risk based capital ratio required by regulators to maintain "well capitalized" status formally remains 10%. So $100 million of 20% risk-weighted bonds requires $2 million of capital ($100 x 20% x 10%) versus $100 million of 100% risk-weighted loans requiring $10 million of capital.

If the amount of capital needed for a line of business, a product, or a customer varies based on risk, then it makes sense to measure the profitability of what is measured based on capital required. In industry parlance, we call that Risk Adjusted Return on Capital, or RAROC.

Financial institutions should assess on their own the amount of capital needed per product based on past experience, perceived risk, and potential loss. The table below shows how capital is allocated to each loan category based on a limited risk spectrum (credit, interest rate, and liquidity). Although for loans, these are probably the greatest risks, the financial institution may quantify other risks, such as operational (could it lose money due to fraud, hacking, etc.) or pricing (does the value of the asset fluctuate in the market, causing volatility and therefore risk).

I perform such an analysis for an ABA School of Bank Marketing Management course that I teach every May.  For my efforts I have been criticized that the topic was too complicated and I should remove it. But the course is on product profitability. How should I measure the relative profitability of business checking versus a home equity loan? Risk and the capital to support that risk should be the denominator in that equation. Agree? I say the topic stays. I'll take my lumps in the course evaluations.

What does your FI use as the profitability denominator?

~ Jeff

Wednesday, 2 May 2012

Is branch profitability out the window?

About 10 years ago my firm analyzed the hundreds of branches in our profitability database to determine exactly what is "critical mass". We sorted by pre-tax profit contribution as a percent of branch deposits, and further sorted by "direct" profits and "fully-absorbed" profits.

The results were not surprising to me. In order to be profitable on a direct cost basis, a branch needed to be $9.5 million in deposits, on average. Fully absorbed cost bases... $18.7 million. In order to deliver a pre-tax profit of 1.5% of average deposits, the branch needed to be $23.6 million.

A note about the data: Branch spreads are calculated using funds transfer pricing (FTP) on a co-terminous basis. This means that interest rate risk is removed from the equation. Deposits receive a funds credit for a similar or identical duration market instrument, such as a Federal Home Loan Bank borrowing. Branch loans similarly receive a funds charge. Fully absorbed costs include allocations from support functions such as Deposit Operations and IT, and overhead functions such as Finance and Executive.

In preparation for a banking school where I am scheduled to teach this month, I recreated the analysis, knowing that the average branch deposit size went up. The results were alarming (see table).


Today, based on the revenues generated and expenses incurred, a branch must have $31.3 million in deposits to break even. To absorb the army of support personnel, systems, and facilities serving it, the branch must be $61.5 million. To generate a 1% pre-tax profit, it must grow to a whopping $121.8 million. That's New York City big, folks.

How can this be? One reason is the extended interest rate environment, where checking accounts can't go lower than 0% interest. The market based credit, or re-investment rate, has been very low for quite some time. Perhaps you hear your CFO lamenting that he/she has no place to put more deposits. This has caused the spread on deposit products to be a historic low of 1.23%.

Another reason is declining deposit fees. When bankers began implementing automated overdraft protection, the bounce in total deposit fees as a percent of deposits was palpable, typically 50 - 60 bps. Today, due to regulation and customer behavior changes, deposit fees as a percent of deposits range between 30 - 40 bps, a noticeable decline.

Lastly, bankers have not adjusted the branch model fast enough to compensate for declining revenues. We typically have six or seven staffers, mostly tellers, in spite of transaction totals being low and trending lower. We maintain the high real estate costs from the branching boom of the late 90's through the mid 2000's. So branch expenses remain around $600 - $700 thousand per year in operating expenses. Indirect expenses to run a branch (Deposit Ops, IT, overhead, etc.) add another $500 - $600 thousand to the expense pool. This is quite a millstone to overcome when the average branch is generating 2.02% in total revenue as a percent of deposits.

In order to bring back branch profits, three things need to occur, in my opinion: 1) drive more revenues through branches in the form of small business and consumer loans, and right size our deposit mix to maximize spread, 2) re-tool the branch model, using fewer full-time equivalent people with multiple skill sets including business development, customer service, and transaction processing... and have less space, and 3) hope for the spread miracle that will come when the Fed has had enough with zero percent at the short end of the yield curve.

Yes, I said hope. How do you think FIs can increase the profits in their branches?

~ Jeff

Tuesday, 20 March 2012

Vblog: The Benefits of Niche Profit Reporting with David Acevedo

I regularly attend industry conferences and occasionally will particpate as an exhibitor. One of the benefits of spending long hours in the exhibit hall is to take advantage of the industry expertise plainly evident as you roam the aisles.

Today a financial institution CFO asked what we thought about measuring the profitability of certain niches, or SEGs in credit union parlance. None of my firm's clients were doing that, but I thought it was a great idea. So I sought the counsel of David Acevedo of 360 View to ask his opinion of the benefits of niche/SEG profitability reporting. Here is our brief interview at a relatively noisy exhibit hall.


How would you use such reporting to meet your FIs objectives?

~ Jeff

Saturday, 10 March 2012

Bank Cost Structures: Mostly Fixed

I recently taught Bank Profitability to a Washington Bankers' school. As part of the curriculum, we discussed the cost structure of financial institutions and how it impacts decision making.

True to the subject, we discussed using product profitability data to make decisions. For example, if a product is unprofitable, should we make changes to it or cut our losses? The answer is not so easy, in my opinion.

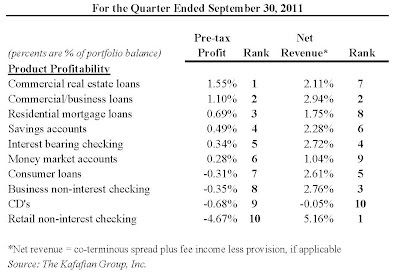
In reviewing the table below, one might conclude that we need to do something about business checking. How can such a core offering be ranked eight of ten in profitability? But, as with everything, there are reasons.

One is how profitability is measured. The method from the table is using funds transfer pricing to determine the spread generated from the product. In such a low interest rate environment, the funding credit is at historic lows. Aside from the interest rate environment, the product's profitability is determined by fully absorbed costing. This begs the question about the variability, or lack thereof, of operating costs.

Community financial institutions don't have much in terms of variable costs. Let's ask the question, what cost would be reduced by discontinuing this product? The answer... very little. Perhaps the core processor charges per account, and the business is on bill pay, also invoiced per account. But will we reduce branches without the product? Probably not and branches represent a significant cost to deposit products.

This is why leveraging your FIs infrastructure is so important to profitability. We have a step variable cost structure. That means we buy resources in bulk. Similar to buying a palate of Hot Pockets at Sam's Club, we add resources and then utilize the resources over time until they are exhausted. If properly utilized, the FIs operating cost ratios should decline over time, until the infrastructure becomes stressed.

How do you tell when your infrastructure is stressed? One CEO uses the parking lot theory. He looks out in the parking lot to see how many cars remain at the Bank after 6pm. I'm sure there are other, more sophisticated methods, but the overall point is that there is a consistent, downward trend in operating cost per account.

In terms of strategic decision making, understanding the FIs cost structure may motivate the FI to increase volumes in business checking, knowing that the marginal cost to add more accounts is minimal, and the revenue per account is significant (3rd greatest in the above menu). Not to mention that the average balance per account tends to be greater than most others. Discontinuing a product based on its fully absorbed profitability simply pushes the costs currently borne by the doomed product to other products.

How do you use your profitability information?

~ Jeff

Tuesday, 3 January 2012

In Pursuit of Return on Equity

When performing ratio analysis to determine a company's profitability we should remember that a ratio has at least two data points: a numerator and a denominator. It doesn't matter if it is banking, retailing, or widget making.

In banking, the standard profitability ratio has long been return on equity (ROE). That is... until the financial crisis of 2007-08. It was in the aftermath that capital, the denominator in the return on equity calculation, resumed its place as king.

Where has the pursuit of ROE led us? Yes, it made us focus on profitability, the numerator in the equation. But it also resulted in us looking at bank equity. The smaller the E, the better the ROE, right?

Bond salesman loved the concept. They encouraged their bank clients to borrow from their respective Federal Home Loan Banks (FHLB) or chase high cost deposits to fund the bonds they sold for minuscule spreads. The logic: blow up the balance sheet, eek out incremental profits, and reduce the E. Genius! And equity analysts, who coincidentally worked for the same firms as the bond salesman, loved it too.

During the period 2002-07, when loan growth outpaced the ability to fund it, FIs took on more FHLB borrowings and high cost deposits. This was a higher spread concept, because loans typically had greater yields than bonds. Loans also typically had greater credit risk. FIs did provision for such losses, but accounting rules and how the SEC enforced them did not allow FIs to "over-reserve", whatever that means. This was determined by the high profile case the SEC brought against SunTrust in the Fall of 1998 for managing earnings through the loan loss provision. Read a summary of it from the Atlanta Fed here. The Fed research piece on the subject, written in 2000, is almost comical to read given what has happened.

So, in pursuit of ROE, banks leveraged up their balance sheet. They thinned their capital leaving them more susceptible to distress during economic hard times. This distress was clearly evident when I recently performed some "where are they now" research on the highest performing ROE FIs in 2006, the last normal year prior to the crisis (see table).

A note on the data. I searched all publicly traded banks and thrifts that existed in 2006 and sorted them by the highest ROE. But I also ensured that their prior year ROE was similarly high, in order to weed out one-time gainers. In other words, I wanted consistent, high ROE FIs.

The results are telling. Of the top 10 ROE FIs of 2006, only three are currently profitable. Two are under a regulatory agreement. The remaining five failed. Yes, failed.

How does an FI, sitting atop the ROE chain, fall so far so fast?  As mostly always the case, it was bad loans. But many if not most FIs have had loan troubles. What made so many in this group take the perp walk to the FDIC? I already mentioned their inability to put extra away for a rainy day via the loan loss provision. But the pursuit of ROE encouraged levering up the balance sheet to leave little in excess equity to absorb the losses. Inadequate loan loss allowance, relatively low equity. The recipe for disaster in bad times.

I think ROE will re-emerge as ONE important indicator of profitability. But I don't think we will make the same mistake twice. Having the past three years as history in our loan loss allowance calculations, our regulators and the SEC will probably permit us to be more aggressive in provisioning. Needing the federal government to chip in capital because we did not have enough to withstand the storm is resulting in higher capital requirements, and lower ROE expectations. Analysts take note.

What do you think should be the primary measure of FI profitability?

~ Jeff


Sunday, 26 June 2011

Don't let perfect be the enemy of very good in bank profitability.

When I began my journey as a bank consultant, my firm's top-notch cost accountant repeated this post title to me often. He was teaching me the mechanics of cost allocations from support centers to profit centers in FIs, and further down to products. The key, he told me, was to develop a rational allocation method that is understandable to those being measured and apply it consistently.

As FIs drill down to relationship and customer profitability, cost allocations become ever more complex and subject to greater challenges by those that disagree with the results. Usually those that disagree are responsible for relationships they once thought were profitable to the FI, but the data shows they fall short. It is easier to challenge the results than to ask "why?", and develop an action plan to improve profitability.

Even though the American Management Information in Financial Services (AMIfs) considers me a certified cost accountant, I put to you that I am not. I come from the line. I am on the line of my firm. I think more like a profit center than a management accountant. So I will not bore you with a discussion of standard versus fully absorbed costs, as I would find it incredibly boring to type, let alone ask you to read.

But there is a rational, middle ground method to drill fully absorbed costs to get an individual operating cost per account. My firm's current profitability software calculates fully-absorbed average costs per account. This means that if I have a checking account, and visit the teller 20 times in a month, I am charged the same cost for my account as someone that solely does 10 Internet banking transactions per month. Those responsible for customer relationship management (CRM) or other account-level profitability software cry foul. And they are right.

But to get to the most exact data takes a tremendous amount of effort that will yield results that are as near to 100% accurate as possible on the day the measurements were taken, and veer from the ideal thereafter. So how can we measure cost per account that rewards low transactions or usage of low-cost distribution channels? I propose developing an easily explainable and defensible fully-absorbed cost per account that differentiates based on account usage.

To do so, you must first determine the fully absorbed cost per account. For example, the average annual cost per retail non-interest bearing checking accounts for my firm's profitability customers was $396 during the fourth quarter 2010. Adding that cost times the number of accounts yields the aggregate operating expenses used to originate and maintain those accounts.

If we divide the number of accounts into quintiles based on number of transactions, we develop pools of accounts to assign different costs. We then can take the "moderate" accounts, and assign the average cost per account, and increase costs for those with greater than moderate transactions and less costs for those with fewer (or cheaper) transactions (see table).

 
Transaction counts can be weighted to differentiate between high-cost transactions, such as a teller transaction, to low cost, such as an Internet banking transaction. Your FI might estimate that one takes 3 times the amount of resources as the other, so one teller transaction counts as three, whereas the Internet transaction remains at one. In this way, the customer that does 25 Internet transactions is not charged the same cost as the one that does 25 teller transactions.

The results will not be exactly correct. But there is no management information that is exactly correct. It will, however, be what one CEO termed "directionally correct". It will tell the relationship manager what customers are profitable and need to be paid attention to, and what customers are unprofitable and action must be taken to gain more business from that customer or pay attention elsewhere.

This behavior, multiplied by every relationship manager and account service representative in your FI, will improve retention of profitable customers, generate positive action toward borderline customers, and focus attention on the right locations, products, and distribution channels to serve your most profitable customers. In short, it will improve your FIs profitability.

How do you measure profitability or how should you measure it?

~ Jeff

Friday, 18 June 2010

Branch Math: To branch or not to branch?

Opinions are wide and varied on the subject of branching. Trends indicate that more customers are using electronic means to interface with their bank and are visiting branches much less. However, customer surveys continue to favor branch locations as a critical factor in determining where to bank. In the mid 1990's, many industry professionals feared branch extinction. The former Commerce Bank of Cherry Hill, New Jersey proved these fears wrong by racking up impressive growth and profitability numbers through de novo branching.

But as branch lobbies become emptier, senior managers are wondering again if branching is becoming a dinosaur. I predict branches as we know them will slowly become obsolete. I do not know the date of their obsolescence.

I do think banks must be more exact in the communities they select and the types of branches they build. Reasons for branching into a community are wide and varied. But typical themes I have heard include: a builder saved a pad site for the bank; a senior manager lives in that community; and the CEO has a second home there. Before branches popped up on every street corner, margins were greater, and the cost to erect a branch was not so dear, this approach may have still yielded positive results. Today, a branch built without rigorous analysis is more likely to be unprofitable and a candidate for closure.

Here are a few questions senior managers should ask themselves prior to branching:

1. What customers are the focus of our strategy?
2. Where are concentrations of these customers located?
3. What are the market demographics of the communities where these customers are located (growing, shrinking, etc.)?
4. How many competitors are there?
5. Is average branch deposit sizes growing or shrinking in these communities?
6. Do we have the ability to attract quality bankers to serve these communities?
7. Are there attractive sites to open a branch that is convenient and consistent with our brand?

After answering the above, senior managers may want to get busy with Branch Math. I built a branch profitability model designed to estimate the income statement impact of a prospective branch (see below).


Assumptions, such as deposit growth, can be tested looking at other branches in the community or nearby communities, and past experiences the bank has had opening branches. Senior managers can model base, worst, and best case scenarios in order to make an informed decision and give the Branch Administrator and prospective Branch Manager a template to guage success.

Note that the branch is charged the opportunity cost of building the branch (i.e. the interest income foregone by buying land and paying a builder to erect the branch). This gives senior managers an idea of the higher hurdles they are creating for hitting profit targets if they build a palace. I often see this expense overlooked.

The future of banking is being determined at a pace not seen since the Great Depression. Much of it is being decided in the halls of Congress. But most is being decided in the minds of our customers and prospective customers. Part of that future will be the importance of branches. To give new branches the greatest chance to succeed in this evolving world, we must inject greater analytical rigor in determining where to branch, and the type of branch to construct. In a highly competitive marketplace, having a higher percentage of branches delivering desired profitability will help your bank stand out in the crowd.

- Jeff